Recently the power bill went up which got me to finally get around to doing power cost calculations. Unfortunately the UPS I have (SmartUPS 1400xl) only puts out a % of load rather then how many watts are flowing through it.
In my homelab I use Zabbix for monitoring all my systems and alerting me to problems. I had originally planed on using Grafana but never figured out how to send the data over. Then I found a plugin that would use the data from my existing Zabbix install to populate Grafana for great looking Dashboards. Which brings me to this post.
Zabbix has a feature built in that will allow you to use existing data to calculate a new field in the data set. It is called Calculated item. Zabbix has documentation on this but like most Zabbix documentation its not the easiest to understand. Thankfully there are people much smarter then me that can make it easy to figure out. link
Previously I had installed a template for monitoring my UPS’s. That template can be found here.
Modifying a Template.
We are now going to modify the UPS monitoring template. I am using Zabbix 5 so you may have slightly different navigation then mine but it should be similar. to what is below.
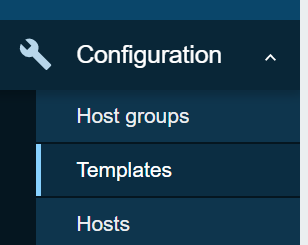
Expand Configuration >> Templates.
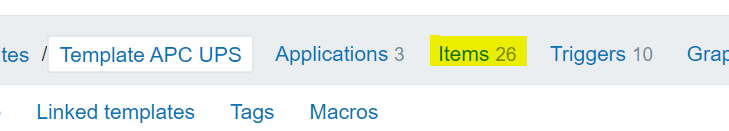
click the link for your template your modifying.

select the items tab at the top.
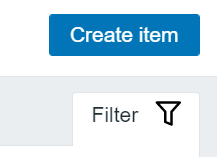
click create item in the upper right hand corner.
Change the type to calculated then you can then fill in the highlighted fields in the screenshot below.
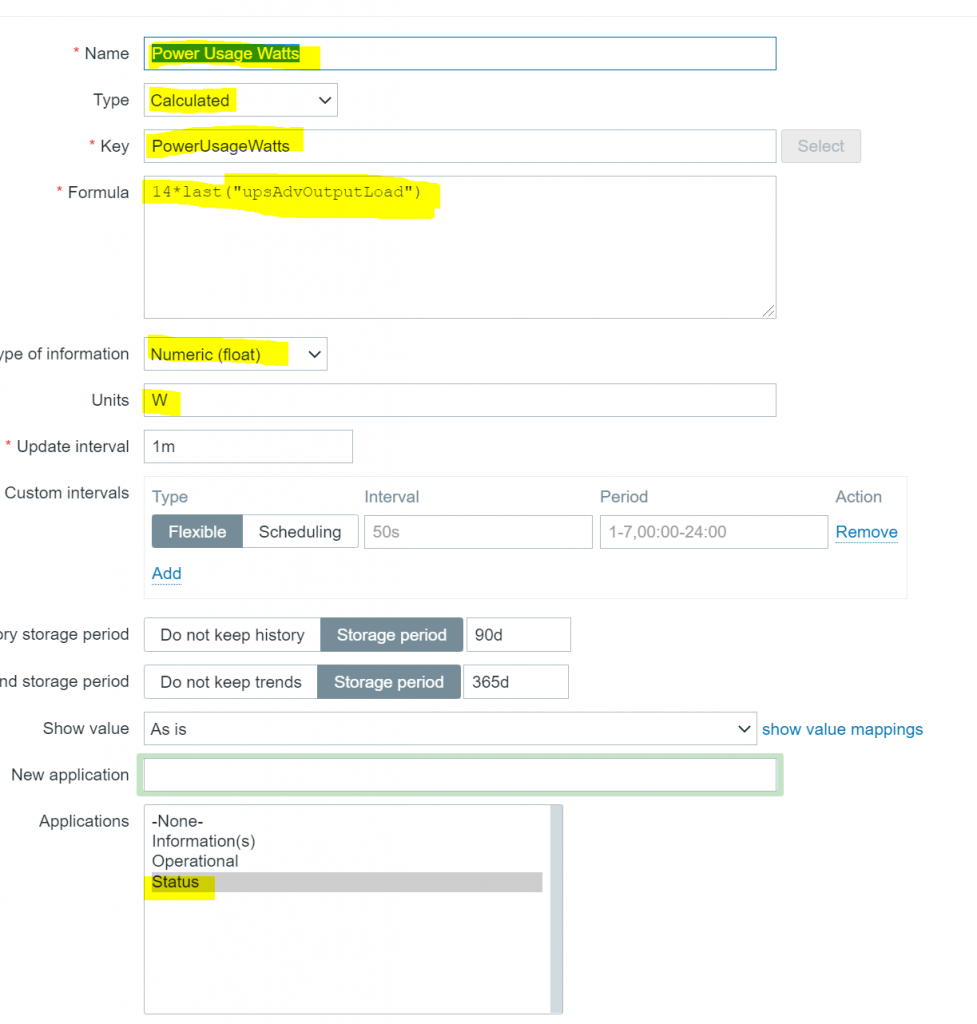
Name : The Name you want to use.
Key: The name Zabbix will use (think variable name).
Formula: the actual calculation you are preforming.
The percentage is stored as a value (ie 30) instead of a percentage. Effectively this means that the decimal point has been moved by 2 points. In my case I have a 1400VA ups. So I will be multiplying the percentage number by 14 this accounts for the decimal points being moved due to how the percentage is stored. For example if you had a 750VA ups you would multiply by 7.5. This formula should give me my power usage in watts.
Type of information: Select Numeric (float) since we will be dealing with decimal places.
Units: You can type what ever you want in this field I chose W for wats.
Applications: I thought it fit nicely in Status you can use anything you want here.
Now that we have our Watts calculated we need our KWH since this is what we are billed in.
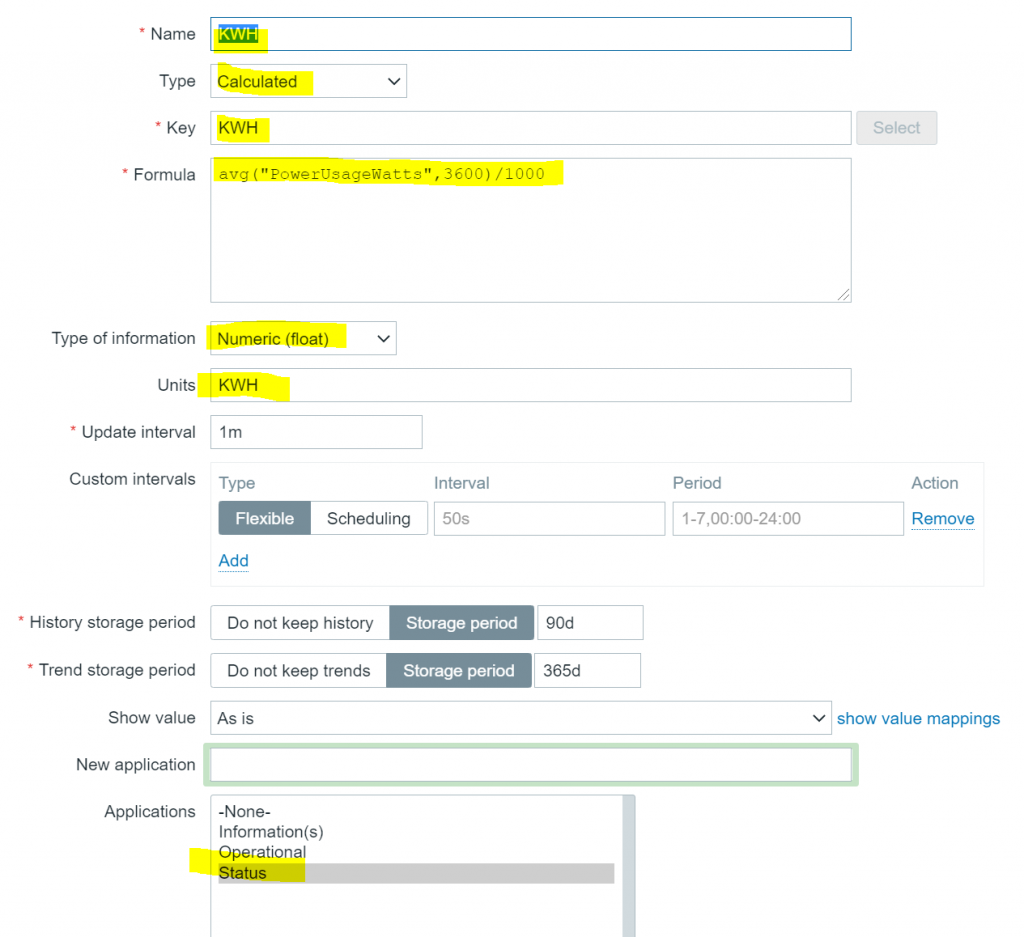
For this formula I am taking the average watts over the last hour (3600 seconds) and dividing by 1000 to calculate KWH.
Now that I have my hourly usage I can then calculate my daily cost.
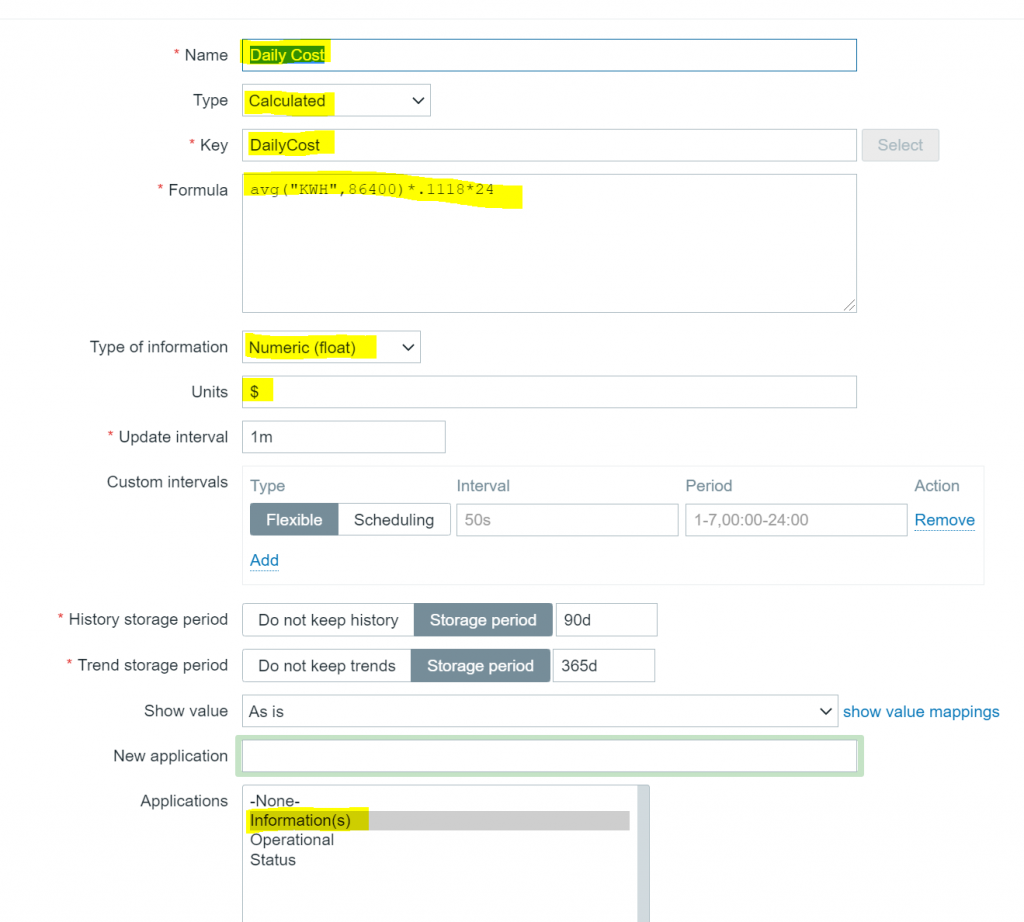
in this formula I am taking the average KWH over 24 hours (86400 seconds) multiplying it by my utility rate ($0.1118) then multiplying by 24 hours giving me my actual rate.
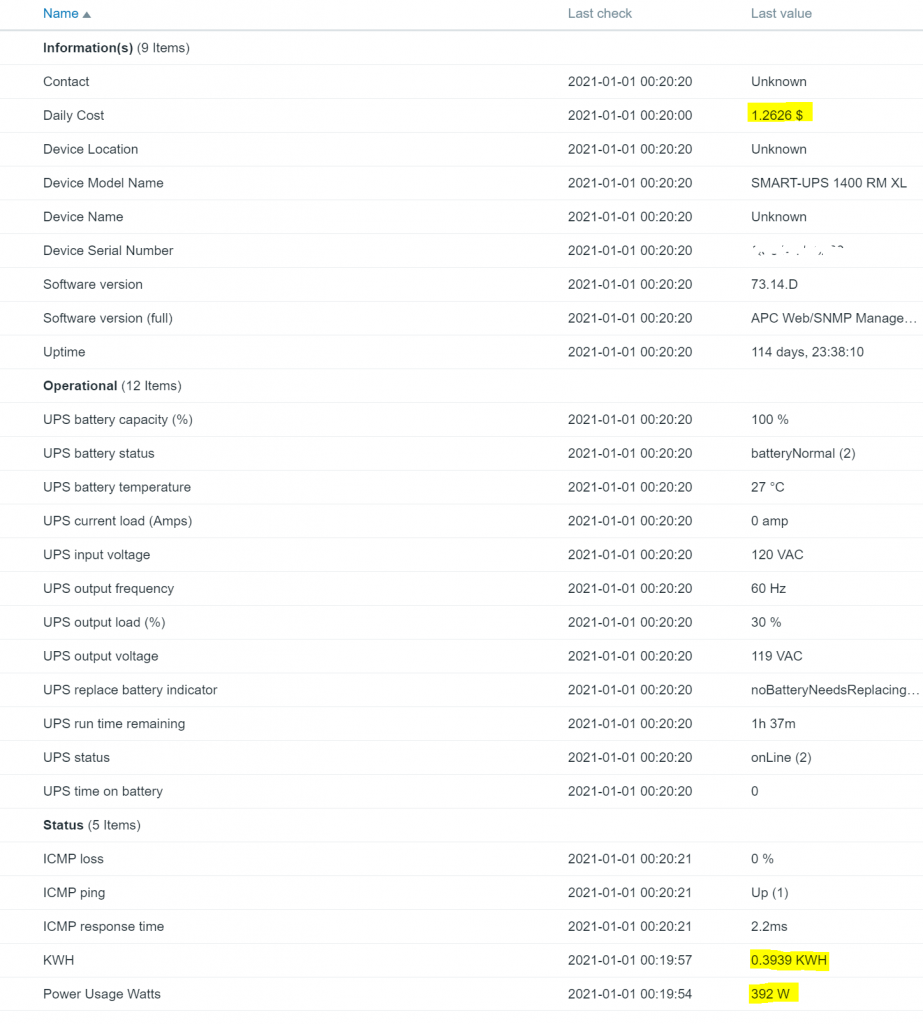
below is the modified version of the template showing the output data.
Populating Grafana
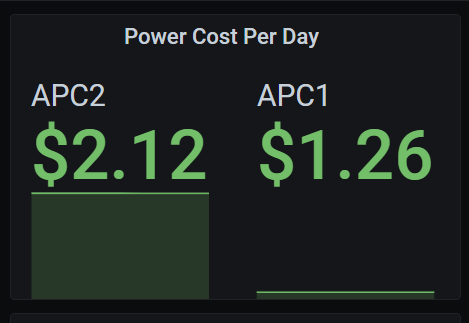
Now that we have the data populating in Zabbix we can update our Grafana dashboard with a new panel.
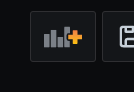
click the new panel icon.
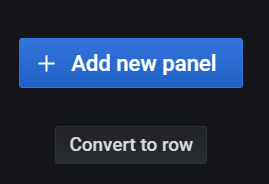
in the new panel that opens up click the add new panel button.
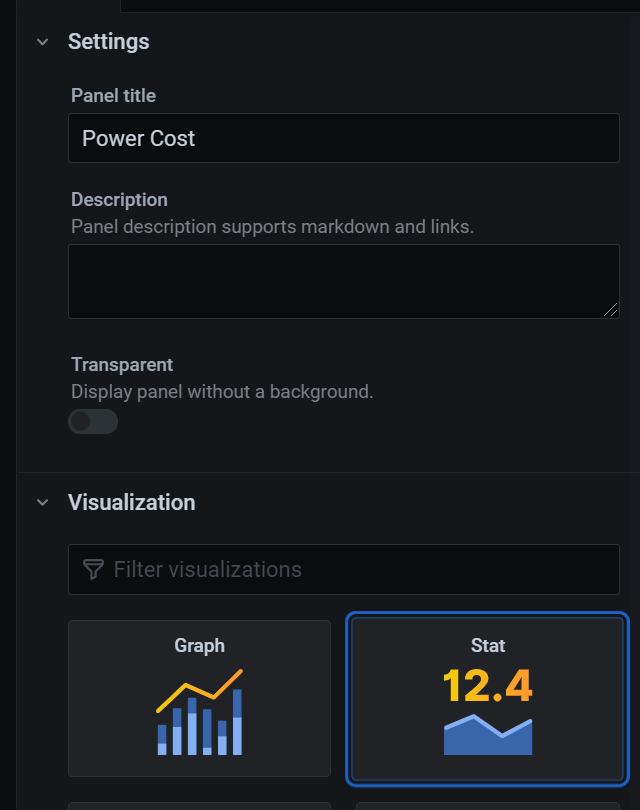
Name your panel then select stat.
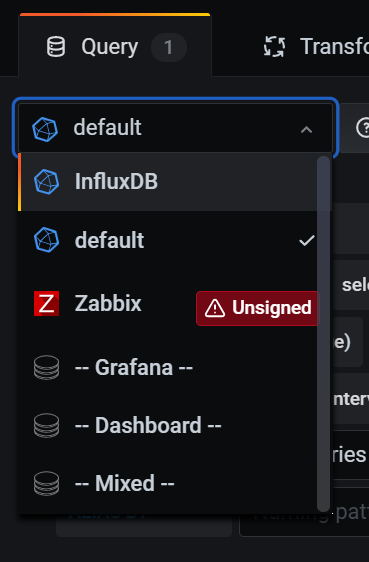
change your data source to Zabbix (sorry I don’t have a tutorial handy for connecting Zabbix to Grafana).
Fill in your data source.
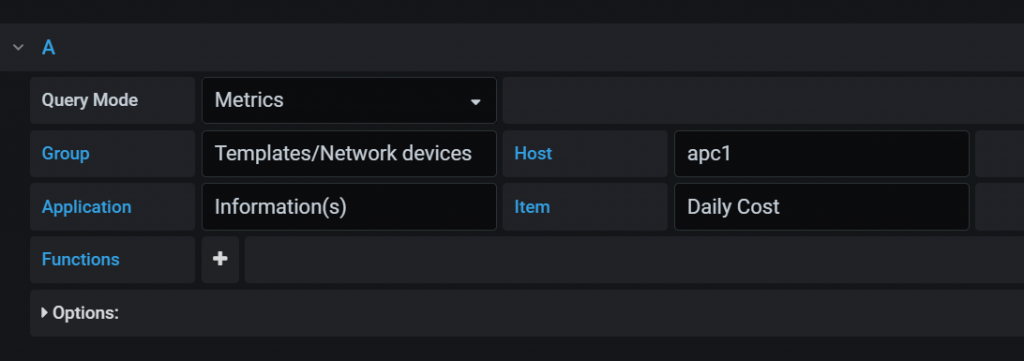
If your like me and have 2 you can fill in a second source to keep them in the same panel.
Save your changes then resize your panel and save your dashboard.